The IMS Income program invests in high-yield bond mutual funds or in the money market for defensive purposes.
The algorithms that change the investment positions are trend following in nature and have been consistently applied throughout the history of the program.
IMS Income
Account Unit Value
July 22, 2024 | $72.05
Investment Results
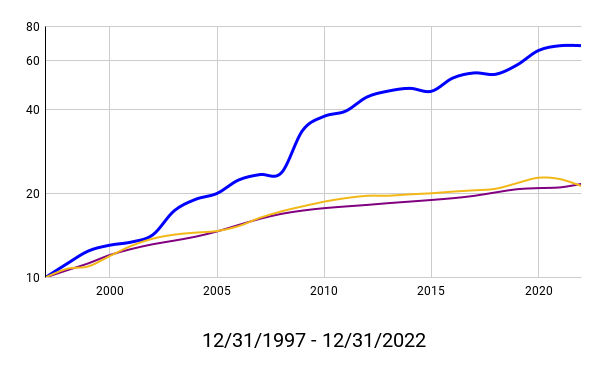
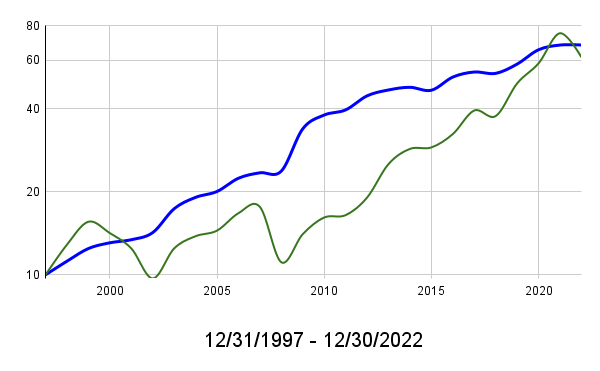
The following charts illustrate the IMS Income investment results from 1998 through June 2022 compared to short-term bonds, certificates of deposit and the S&P 500 Stock Market Index.
The short-term objective of IMS Income is to outperform Short-Term Bonds and Jumbo Certificates of Deposit over three-year periods (first chart).
The long-term objective of IMS Income is to keep pace with the S&P 500 Stock Market Index over several stock market cycles (second chart).
1998 through 2022
♦ IMS Income Initial Account: 573.9%
♦ Short Term Bonds VBISX: 112.9%
♦ 3 Year Jumbo CDs JCDI: 116.8%
♦ IMS Income Initial Account 573.9%
♦ S&P Stock Index VFINX 513.6%
Gains and Risk
Average Annual Gains and Associated Risk from 1998 through 2022.
Investment
Type
IMS Income Initial Account
Vanguard 500 Index Fund (VFINX)
Vanguard Short-Term Bond Index Fund (VBISX)
JCDS Three-Year Jumbo Bond Index
Average Annual Gain
7.9%
7.5%
3.1%
3.2%
Associated
Risk
Low Risk
Substantial Risk
Low Risk
Minimal Risk
Ten Largest Calendar Year Gains
IMS Income
The Initial Account
Year
Gain
1998
12.0%
1999
11.2%
2003
22.0%
2004
10.0%
2006
11.6%
2009
42.3%
2010
12.2%
2012
12.4%
2016
11.6%
2020
12.7%
Short-Term Bonds
VBISX
Year
Gain
1998
7.4%
2000
9.0%
2001
8.8%
2002
6.1%
2006
4.1%
2007
7.2%
2008
5.4%
2010
3.9%
2019
4.8%
2020
4.6%
3 Yr Jumbo CDs
JCDI Index
Year
Gain
1998
6.1%
1999
5.6%
2000
7.2%
2002
4.0%
2004
3.4%
2005
4.4%
2006
5.5%
2001
5.1%
2007
5.3%
2008
4.2%
Five Largest Declines
IMS Income Program
The Initial Account
5/30/2002 - 9/30/2002
-3.4%
1/28/2004 - 6/20/2004
-3.8%
4/22/2010 - 6/29/2010
-3.2%
4/15/2015 - 2/9/ 2016
-5.3%
9/15/2021 - 6/30/2022
-3.6%
_______
Total of Declines
-19.3%
Short-Term Bond Index
VBISX
6/13/2003 - 8/14/2003
-2.1%
3/16/2004 -5/13/2004
-2.7%
3/17/2008 - 6/13/2008
-2.3%
9/7/2017 - 5/16/2018
-1.9%
8/3/2021 - 6/30/2022
-6.1%
_______
Total of Declines
-15.1%
S&P 500 Stock Index
VFINX
9/10/2000 - 9/9/2002
-47.5%
10/9/2007 - 3/9/2009
-55.3%
5/10/2011 - 9/9/2011
-14.3%
2/19/2020 - 3/23/2020
-33.8%
1/3/2022 - 6/30/2022
-18.2%
_______
Total of Declines
-169.1%
Detailed Charts
Open to view charts with detail by day.
IMS Income, Short-term Bonds and Three-year Jumbo Certificates of Deposit
IMS Income and the S&P 500 Stock Index
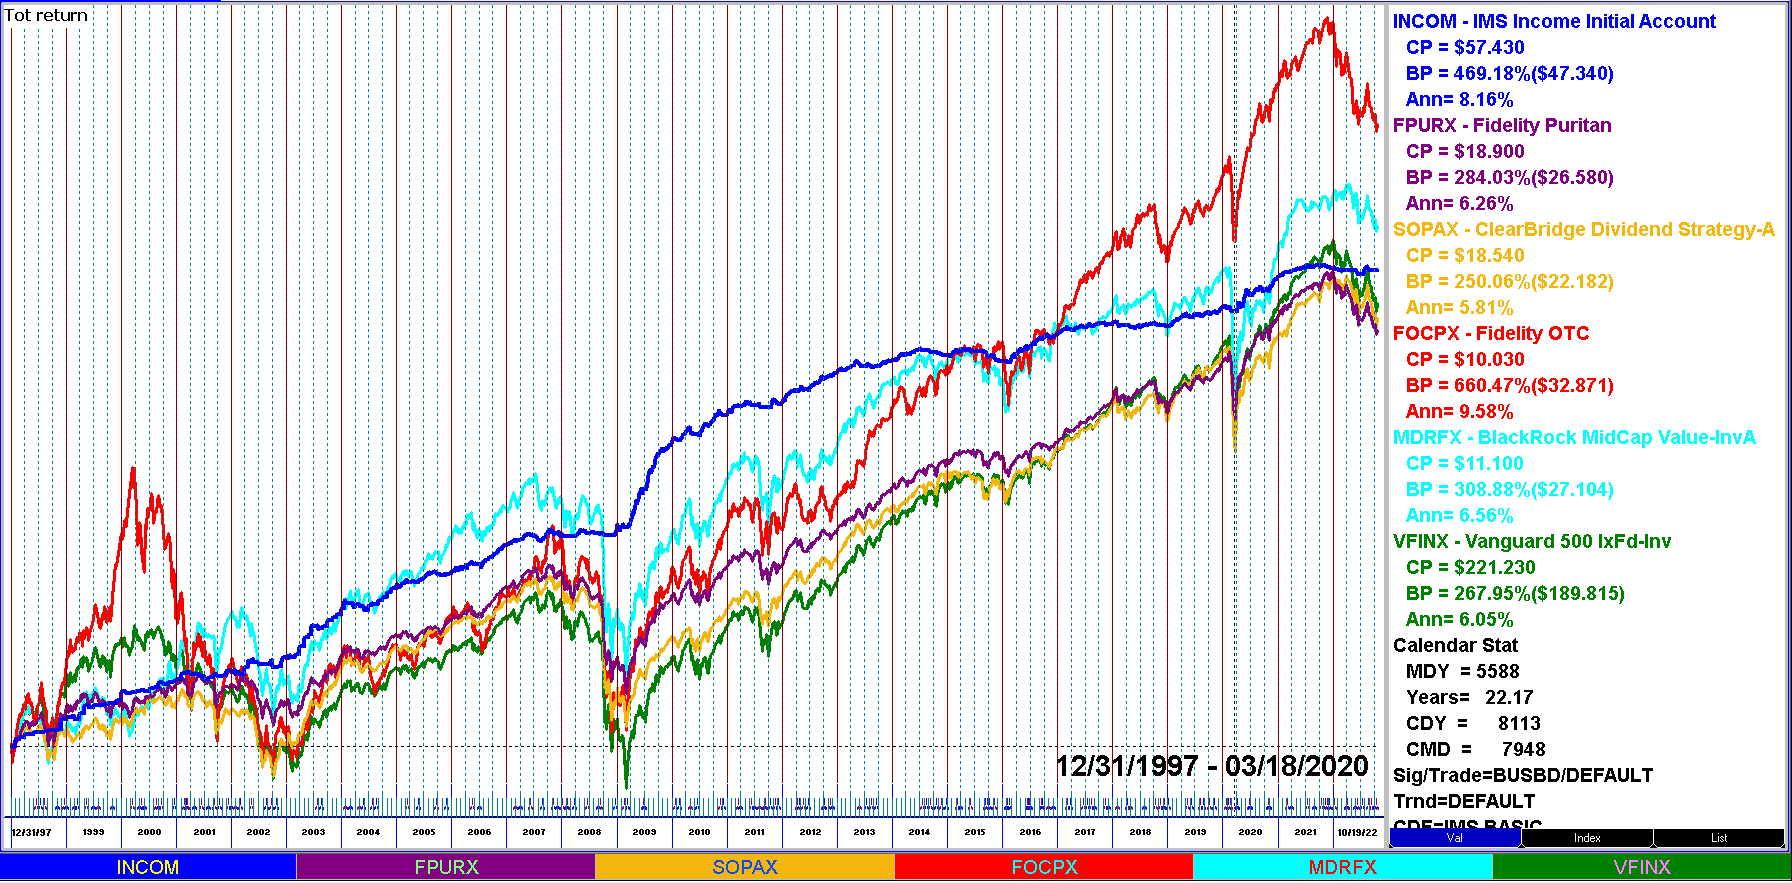
IMS Income, Five Representative Growth Mutual Funds
Past performance is no guarantee of future results. It should not be assumed future performance will be profitable. Investments in equity mutual funds and high-yield bond mutual funds may result in a substantial loss of capital.